
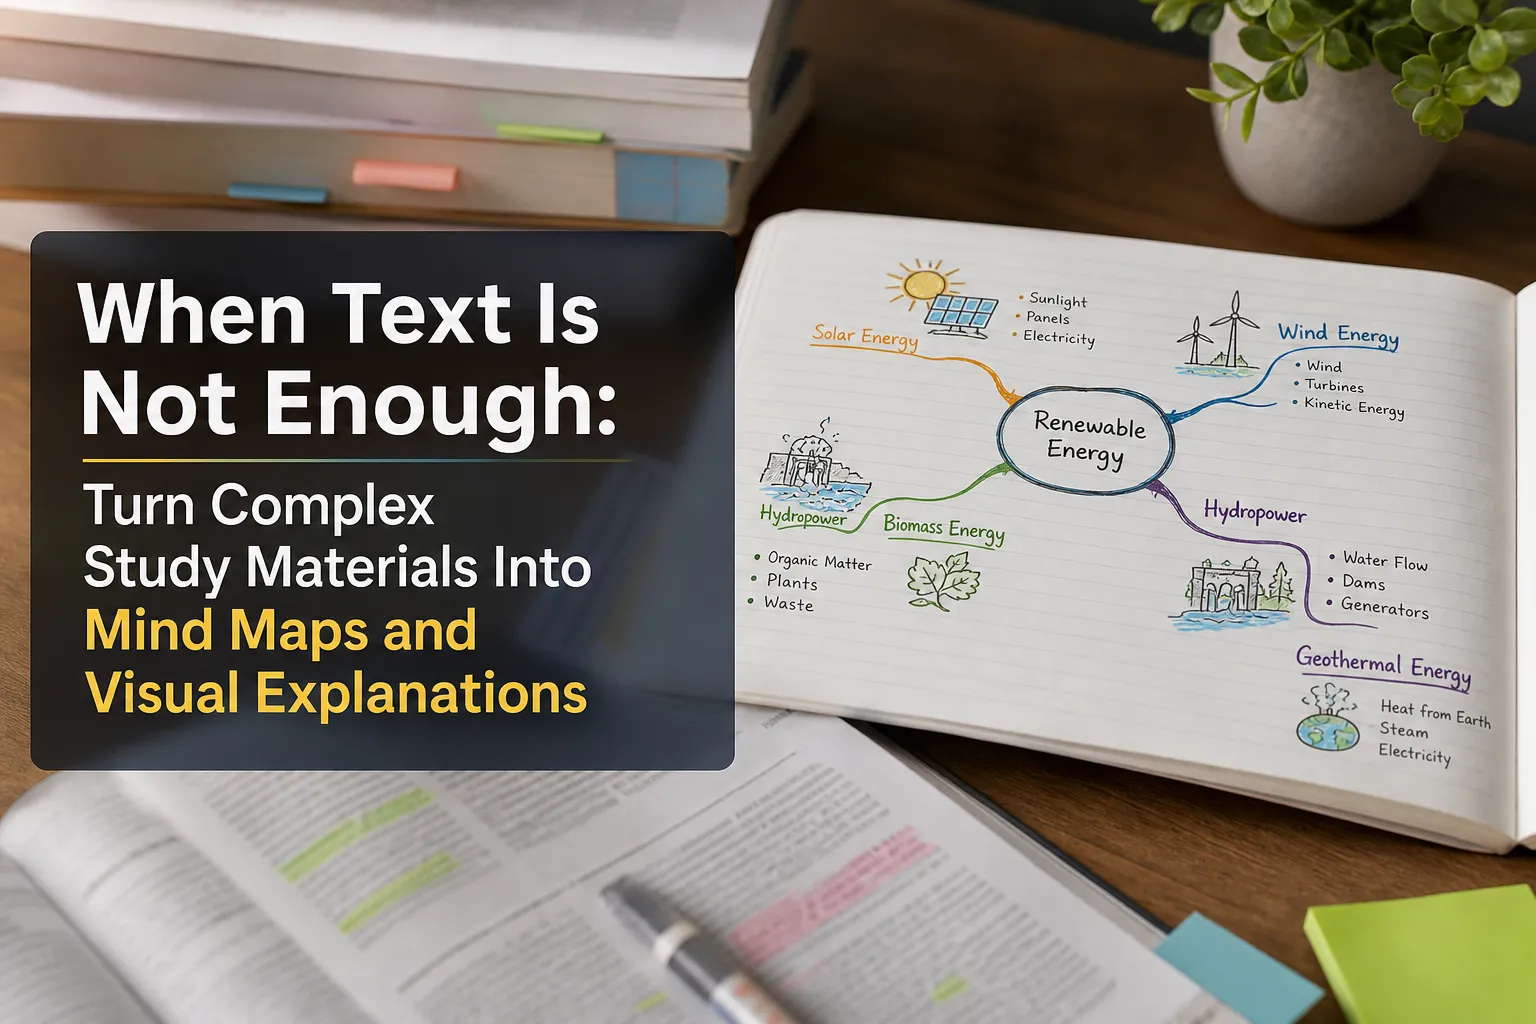
When Text Is Not Enough: Turn Complex Study Materials Into Mind Maps and Visual Explanations
Dense chapters, jargon-heavy PDFs, lecture slides, technical reports, and long videos all create the same problem: the information is there, but the structure is hidden. Learners can read everything and still miss how ideas connect, how a process flows, or why one framework differs from another.
That is where mind maps and visual explanations become powerful. A mind map helps you see the structure of a topic at a glance: the hierarchy, relationships, and major branches. A visual explanation helps you understand how something works: a process, a comparison, a system, a sequence, or an abstract concept.
For students, exam candidates, professionals preparing for certifications, and lifelong learners, AI can speed up this transformation. Instead of manually reorganizing pages of notes, you can use AI to surface the key concepts, group them, connect them to source material, and turn them into study outputs you can actually use.
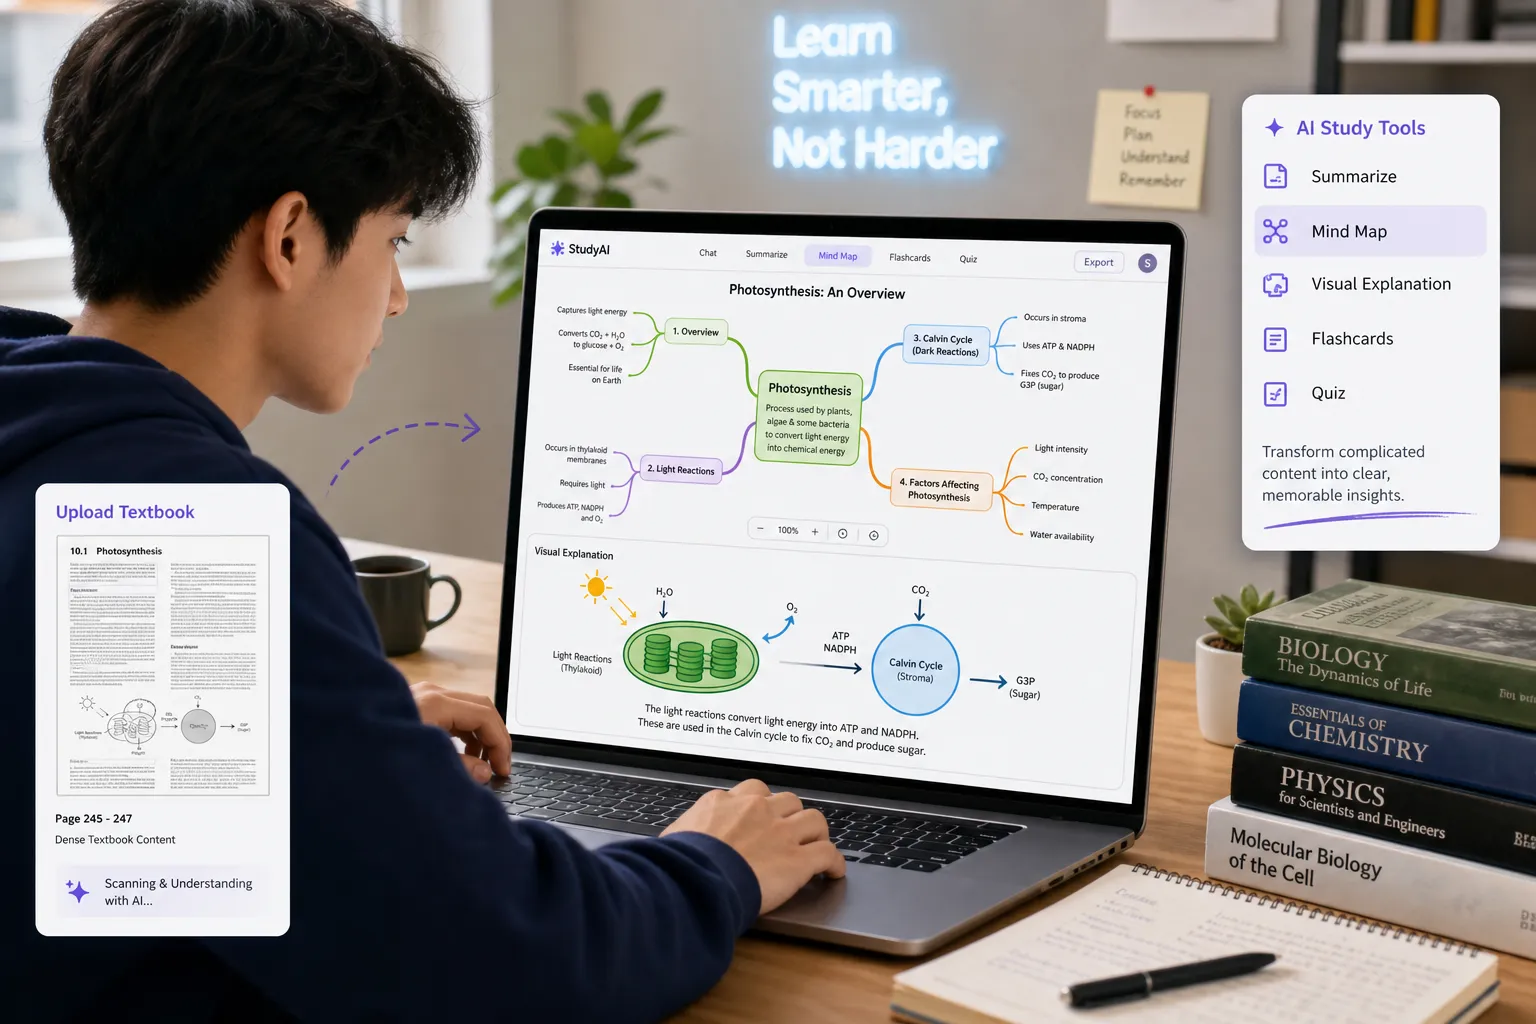
At CramAI, this is part of a broader study workflow rather than a one-off gimmick. Learners can upload materials in multiple formats, generate structured study outputs, trace answers back to the original sources, identify weak areas through dynamic assessment, and connect visual learning with notes, flashcards, quizzes, and exam practice. The result is less cognitive overload and more focused studying.
Why visual learning works better for complex material
Text is linear. Understanding is not.
When a topic includes nested ideas, exceptions, cause-and-effect chains, mechanisms, or competing theories, plain paragraphs force learners to hold too much in working memory. Visuals reduce that burden by making relationships visible.
"Graphical representations of data facilitate the delayed recall of trends, suggesting that graphics can enhance long-term retention of information." - Memory & Cognition / PMC
"A meta-analysis of 55 studies found that learning with concept and knowledge maps was associated with increased knowledge retention across instructional conditions and settings." - Review of Educational Research
This matters especially when you are preparing for exams under time pressure. You do not just need to read; you need to retrieve, compare, apply, and explain. Good visuals support all four.
The two outputs that matter most: mind maps and visual explanations
Many articles lump all educational visuals together, but learners get better results when they choose the right output for the right task.
What a mind map is best for
A mind map is ideal when your goal is to reveal:
topic structure
hierarchy
subtopics
dependencies
conceptual relationships
how details fit into a bigger subject
It is especially useful when turning a long chapter, syllabus, article, or concept-dense PDF into something reviewable.
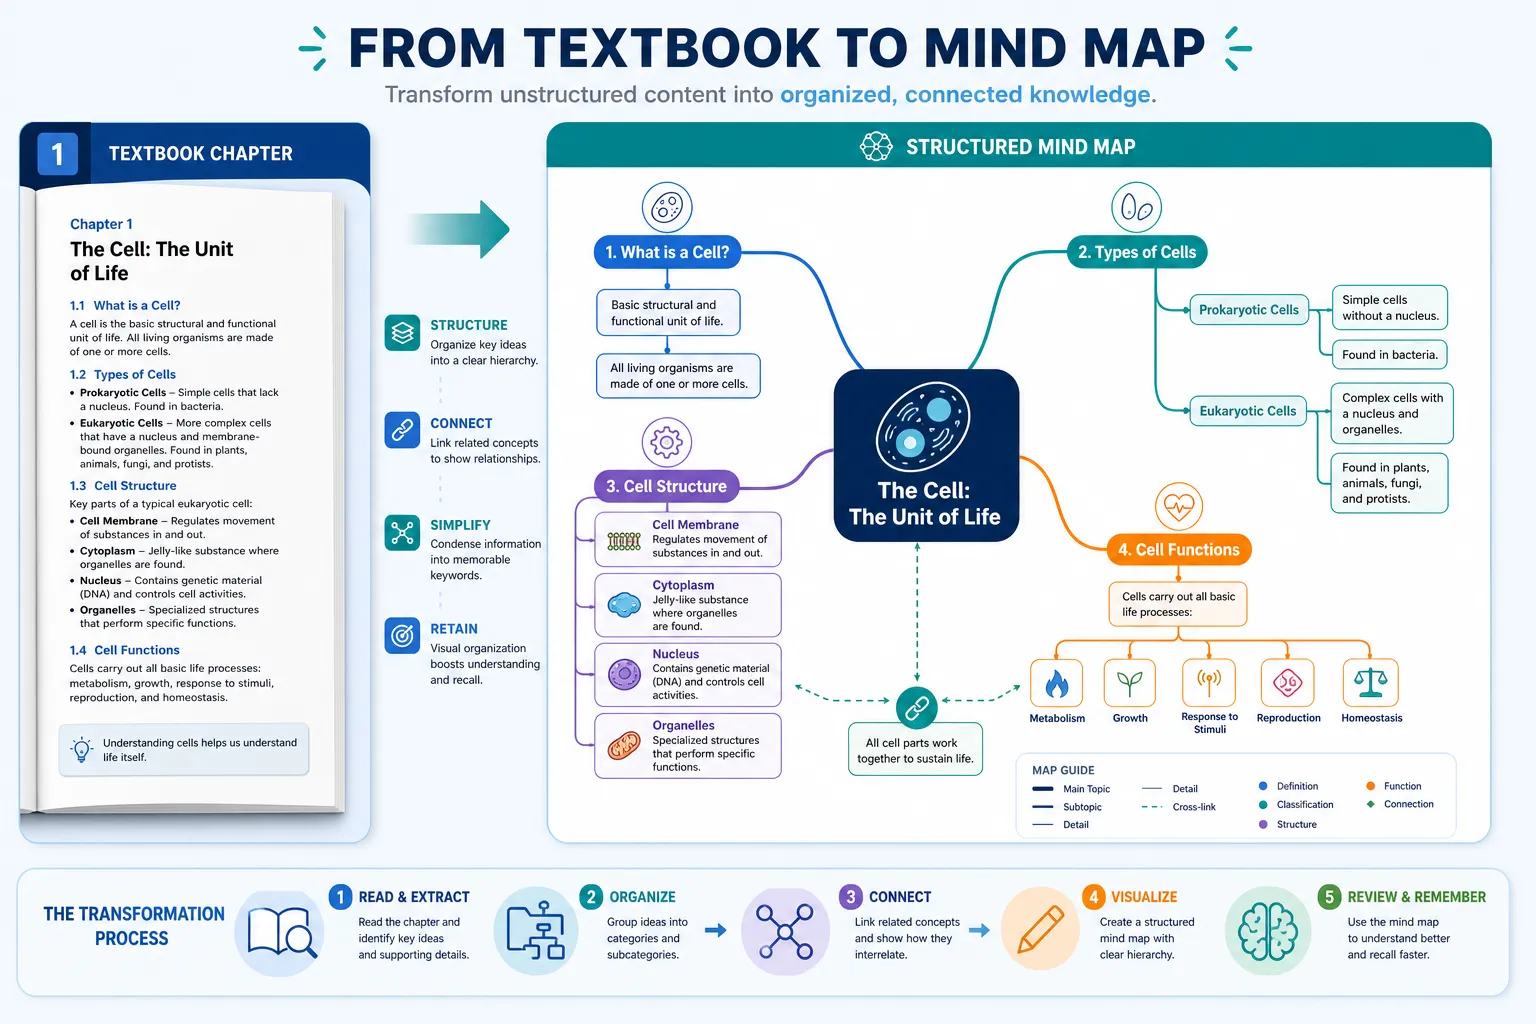
A well-built concept map from PDF or chapter lets you stop rereading everything from scratch. Instead, you can revisit the central theme, scan the branches, and zoom in only where you need detail.
What a visual explanation is best for
A visual explanation is better when the goal is to show:
a process
a mechanism
a system
a sequence of events
a comparison between two ideas
a difficult concept broken down step by step
This is where an AI visual explanation can add real value. Rather than only summarizing content, it can organize it into a flow that shows what happens first, what changes, what interacts, and what the result is.
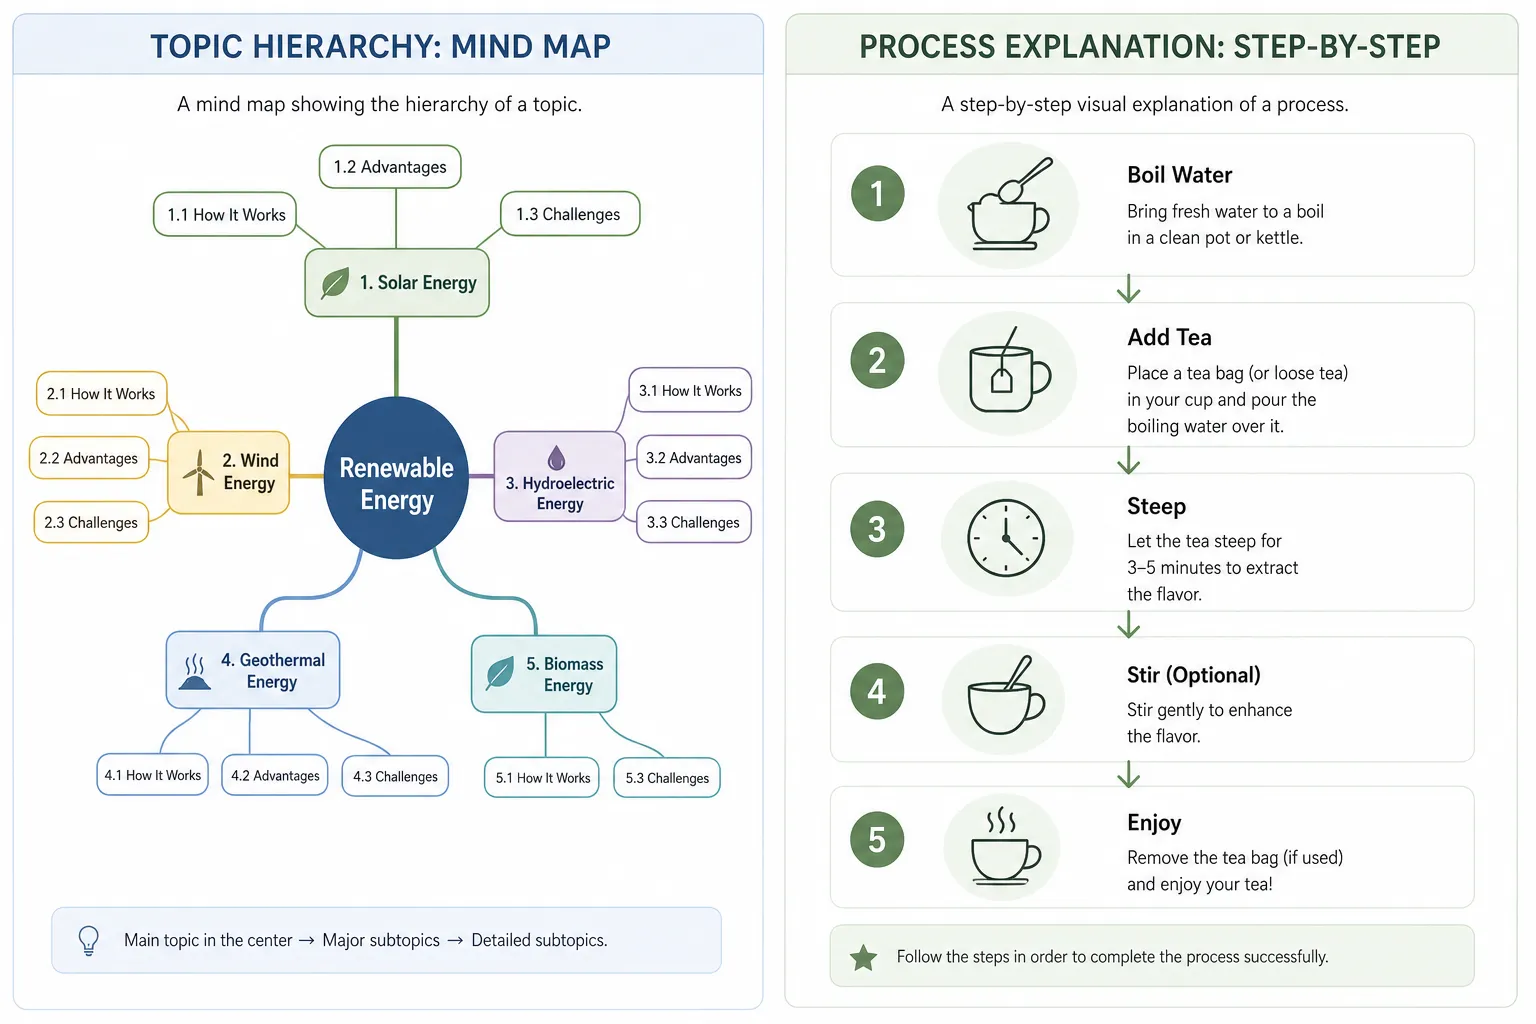
When to use a mind map vs a visual explanation
Choosing the right visual format is half the battle.
Study need | Best output | Why it works |
|---|---|---|
Understanding a chapter’s main ideas | Mind map | Shows topic hierarchy and major branches |
Reviewing lecture notes before an exam | Mind map | Makes large amounts of content scannable |
Explaining how a biological mechanism works | Visual explanation | Shows movement, sequence, and interaction |
Comparing two theories or frameworks | Visual explanation | Highlights differences and similarities clearly |
Mapping a subject across multiple sources | Mind map | Connects concepts across materials |
Breaking down a hard abstract concept | Visual explanation | Turns complexity into steps and examples |
Planning essay arguments from source material | Mind map | Helps group evidence and claims |
Understanding a finance workflow | Visual explanation | Clarifies stages, triggers, and outcomes |
A simple rule helps:
Use a mind map for structure. Use a visual explanation for motion, comparison, or transformation.
How AI turns dense materials into usable visuals
The best AI tools do more than summarize. They detect concepts, relationships, patterns, and study intent.
Step 1: Ingest the material
The starting point can be almost anything:
textbook chapters
PDFs
research papers
lecture slides
website URLs
recorded lessons
YouTube videos
audio notes
class documents
This is where a modern AI study workflow outperforms traditional manual note-taking. CramAI supports multiple content formats, so learners do not have to rebuild everything by hand before they start organizing it.
Step 2: Detect the type of understanding needed
Not every source should become the same kind of output.
An advanced AI mind map generator should recognize whether the material is mostly:
conceptual
procedural
comparative
sequential
explanatory
That distinction helps determine whether the best visual output is a topic map, a process diagram, or a step-by-step explanation.
Step 3: Extract and group key information
This is where AI reduces cognitive load. Instead of forcing the learner to highlight, rewrite, and reorganize every paragraph, the system can:
identify main topics
pull supporting details
group related ideas
surface hidden links across sections
collapse repetition
preserve the source trail
In CramAI, source-anchored answers and traceability matter here. If a visual branch or explanation comes from an uploaded document, learners should still be able to check the original context rather than blindly trust the output.
Step 4: Generate the right visual form
Once the structure is clear, AI can produce one of two outputs:
a mind map for topic organization and relationships
a visual explanation for processes, systems, comparisons, or difficult abstractions
Step 5: Connect the visual to active study tools
This is a major content gap in many competitor articles: they treat visuals as the end product. In reality, visuals are most useful when they feed the rest of your study cycle.
After building a visual, learners should be able to connect it to:
notes
flashcards
quizzes
gap assessments
revision plans
exam practice
That is where CramAI’s all-in-one learning flow becomes practical. A mind map should not sit alone as a pretty diagram; it should become part of how you learn, test, assess, and adjust.
Example 1: Turning a long textbook chapter into a structured mind map
Imagine a 35-page chapter on macroeconomics.
The learner’s problem is not just volume. It is that the chapter contains nested concepts like inflation, unemployment, GDP, monetary policy, and fiscal interventions, each with definitions, causes, effects, and exceptions.
A mind map works well here because it can organize the chapter into:
central theme: macroeconomic stability
branches: inflation, unemployment, GDP, policy tools
sub-branches: definitions, causes, indicators, trade-offs
linked ideas: inflation vs unemployment, fiscal vs monetary policy
The benefit is immediate. Instead of reviewing 35 pages, the learner can scan one structured map, then dive deeper only where needed.
What to verify
Before using the map for revision, verify:
whether important exceptions were omitted
whether the branch labels match the textbook language
whether linked concepts are supported by the original chapter
whether a summary branch has collapsed distinctions that matter for exams
Example 2: Visualizing a financial process or scientific mechanism
Some content is not mainly hierarchical. It is dynamic.
A financial process like how interest rates affect borrowing, spending, investment, and inflation is better explained visually as a chain of cause and effect. Likewise, a scientific mechanism such as synaptic transmission or the Krebs cycle needs arrows, stages, interactions, and outcomes.
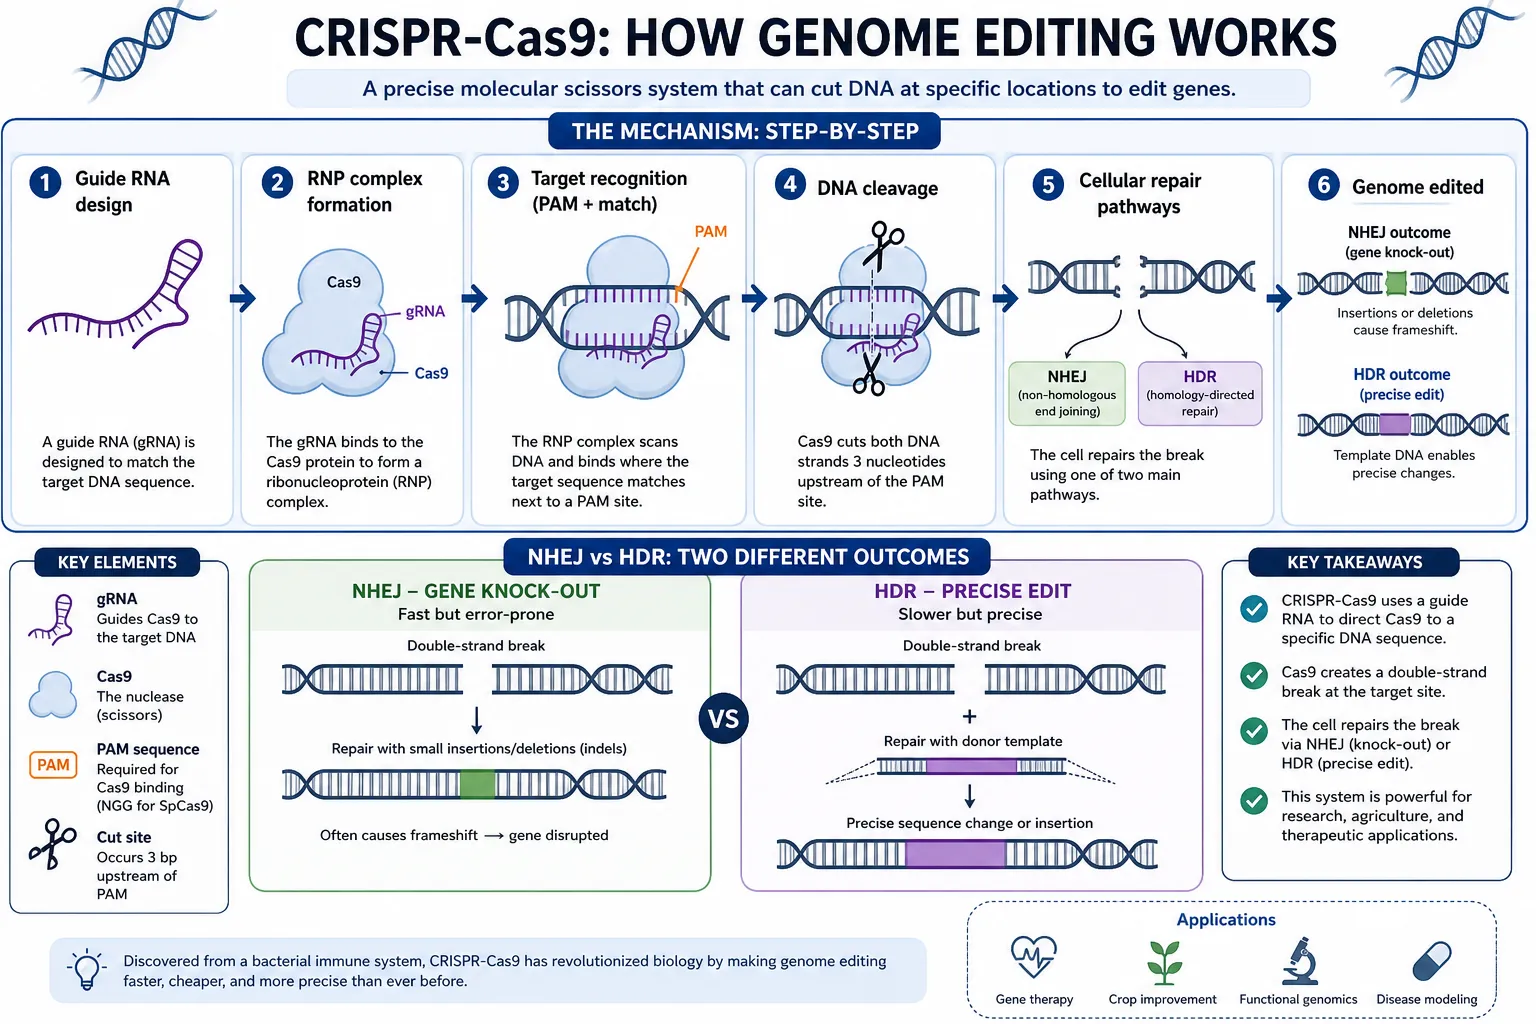
A visual explanation can show:
what starts the process
what each stage does
what variables affect the outcome
where feedback loops occur
where students commonly confuse one step with another
Why this beats a paragraph summary
A paragraph may tell you what happens. A visual explanation shows:
order
interaction
dependency
comparison across stages
That makes it better for topics where sequence matters.
Example 3: Comparing two theories or frameworks visually
Many exams ask learners to compare, evaluate, or distinguish.
Take two frameworks in psychology, law, management, or education. A text summary often mixes them together. A visual explanation can place them side by side with matched categories such as:
assumptions
methods
strengths
weaknesses
applications
criticisms
This approach helps learners answer higher-order questions, not just recall definitions.
Strong use cases
A visual comparison works especially well for:
behaviorism vs constructivism
Keynesian vs monetarist models
waterfall vs agile
rule utilitarianism vs act utilitarianism
Example 4: Breaking a difficult concept into a step-by-step visual explanation
Abstract material often feels difficult because it is compressed.
For instance, a student studying machine learning might struggle with overfitting, not because the definition is unavailable, but because the concept combines training data, model complexity, generalization, error, and evaluation.
A step-by-step visual explanation can unpack it as:
what the model is trying to do
what happens with simple vs complex models
how training accuracy can improve while test accuracy worsens
why this leads to poor generalization
how regularization or cross-validation helps
This is a stronger learning object than a plain definition because it supports mental simulation.
How to verify AI-generated visuals against the original material
This step is essential.
AI can accelerate study prep, but learners should still validate what was generated. Verification is especially important for technical, academic, or exam-sensitive content.
A practical verification checklist
Checkpoint | What to look for |
|---|---|
Fidelity | Does the visual reflect the source accurately? |
Completeness | Were key branches, steps, or exceptions left out? |
Precision | Are terms used correctly and consistently? |
Nuance | Did the AI oversimplify contested or complex ideas? |
Source anchoring | Can you trace claims back to the original material? |
Exam relevance | Does the visual preserve details likely to be tested? |
This is why traceability matters. CramAI’s source-anchored approach is useful because it encourages learners to verify rather than passively accept generated outputs.
Common mistakes students make with AI-generated visuals
Competitor articles often celebrate speed, but speed alone can create bad study habits.
Mistake 1: Treating the first output as final
The first map or diagram is a draft, not the truth. It should be reviewed, relabeled, and refined.
Mistake 2: Using a mind map for everything
Not every topic needs branches. If the content is about stages, mechanisms, or side-by-side differences, a visual explanation may be the better tool.
Mistake 3: Overcompressing the material
If a visual becomes too simple, it may hide key distinctions that matter for assignments or exams.
Mistake 4: Separating visuals from the rest of the study workflow
A visual is more powerful when it becomes the basis for:
flashcards
self-quizzing
practice questions
oral explanation
spaced review
Mistake 5: Not checking the source
Always compare the generated output with the original material, especially when studying from research-heavy or technical sources.
How mind maps and visual explanations fit into a full study system
The strongest learning gains happen when visuals become part of a cycle, not a standalone artifact.
With notes
Use the visual as the top-level structure, then keep detailed notes beneath each branch or step. This keeps depth without losing clarity.
With flashcards
Create flashcards from each branch, relationship, or step. For example:
define a branch
explain a connection
recall the next step in a process
compare two frameworks
With quizzes
Turn the visual into self-test prompts:
“What are the three sub-branches under this concept?”
“What happens after stage two?”
“Which theory assumes X but not Y?”
With exam practice
Use the visual to rehearse likely question types:
explain
compare
evaluate
apply
sequence
justify
With adaptive planning
This is another area where CramAI fits naturally. If a learner performs poorly on one branch or repeatedly misses one stage in a process, the platform can identify that gap and adjust the study plan in real time. That makes the visual output actionable instead of static.
What makes a high-quality AI study workflow different
Not all tools are built for learning.
A generic diagram tool may help you draw. A one-shot generator may give you a quick output. But learners often need something deeper: study support that keeps the visual connected to evidence, practice, and improvement.
What to look for in a serious tool
Capability | Why it matters |
|---|---|
Multi-format input | Students learn from PDFs, videos, slides, and audio, not just plain text |
Source traceability | Helps verify outputs and reduce hallucination risk |
Concept linking across topics | Builds deeper understanding across materials |
Mind maps and visual explanations | Supports both structure and process learning |
Dynamic assessments | Identifies what the learner still does not know |
Real-time adjustment | Keeps the plan focused on high-impact revision |
Creator tools | Helps educators and knowledge creators organize and publish expertise |
CramAI is relevant here because it positions visual learning inside a broader all-in-one ecosystem: learn, test, assess, guide, and support. That matters for students, certification candidates, educators, and even organizations building scalable learning systems.
A practical workflow for students using CramAI
Here is a realistic way to use the platform without overcomplicating the process.
1. Upload your source material
Start with a chapter PDF, lecture slides, a YouTube lecture, a reading list URL, or an audio explanation.
2. Decide your output
Ask: do I need to understand the structure of the topic, or how something works?
Structure = mind map
Process/comparison = visual explanation
3. Review the generated result against the source
Check terminology, missing details, and important exceptions.
4. Add supporting study assets
Create notes, flashcards, and quizzes from the visual.
5. Test yourself
Use dynamic assessments to find weak branches or steps.
6. Let the plan adapt
Focus revision time where the evidence shows you are weakest, not where the content simply feels familiar.
For educators, creators, and organizations
This topic is not only for solo students.
Educators can use visual outputs to explain difficult concepts more clearly. Knowledge creators can turn their expertise into structured educational content. Teams and institutions can use scalable study or training plans built from shared materials.
Because CramAI also includes creator tools for knowledge organization and content generation, it can support not just learning consumption but learning design. That makes it useful for anyone building repeatable explanations, internal training resources, or a personal knowledge brand.
Final verdict
When study material becomes too dense for plain reading, the answer is not always “read harder.” Often, the better move is to change the representation.
Use mind maps when you need to see topic structure, hierarchy, and conceptual relationships. Use visual explanations when you need to understand a process, system, comparison, sequence, or hard abstract concept. Then verify those outputs against the original source and connect them to active study methods like notes, flashcards, quizzes, and exam practice.
That is where AI becomes genuinely useful: not as a shortcut around learning, but as a way to surface what matters, reduce noise, and support deeper understanding.
If you want an all-in-one system that can turn uploaded materials into personalized study plans, source-anchored answers, visual knowledge structures, adaptive assessments, and connected revision tools, CramAI is a strong place to start. It helps you move from information overload to study decisions you can trust.
FAQ
What are the common mistakes in mindmapping?
Common mistakes include making branches too vague, adding too much detail to one map, and using a mind map when a visual explanation would fit better. Another major mistake is failing to verify the map against the original source, which can lead to oversimplification or missed exam-relevant points.
How to make mind maps when studying?
Start with the central topic, then build branches for the main subtopics, followed by key supporting ideas, examples, or definitions. If you use AI, review the generated map against your notes or source materials and connect it to flashcards, quizzes, and exam practice for active recall.
What are the 7 steps to mind mapping?
A practical seven-step approach is: identify the core topic, gather source material, extract key themes, group related ideas, create main branches, add supporting details, and review for accuracy. For study use, the final step should always include checking the map against the original material.
How to create a mindmap from text?
Begin by identifying the main topic in the text, then pull out headings, subtopics, and recurring concepts to organize them into branches. An AI mind map generator can speed this up, especially for long chapters or PDFs, but you should still refine labels and confirm the structure with the source.
Can ChatGPT do mindmaps?
It can help generate the structure or outline for a mind map in text form, which you can then turn into a visual. For serious study use, learners often benefit more from platforms that combine visual generation with source traceability, gap detection, and study tools such as notes and quizzes.
What is the best mind mapping technique?
The best technique depends on the learning goal, but in general, use a clean hierarchy with clear branch labels and only the most important supporting details. For complex studying, the strongest method is to pair the map with verification, active recall, and adaptive review rather than treating it as a standalone summary.